
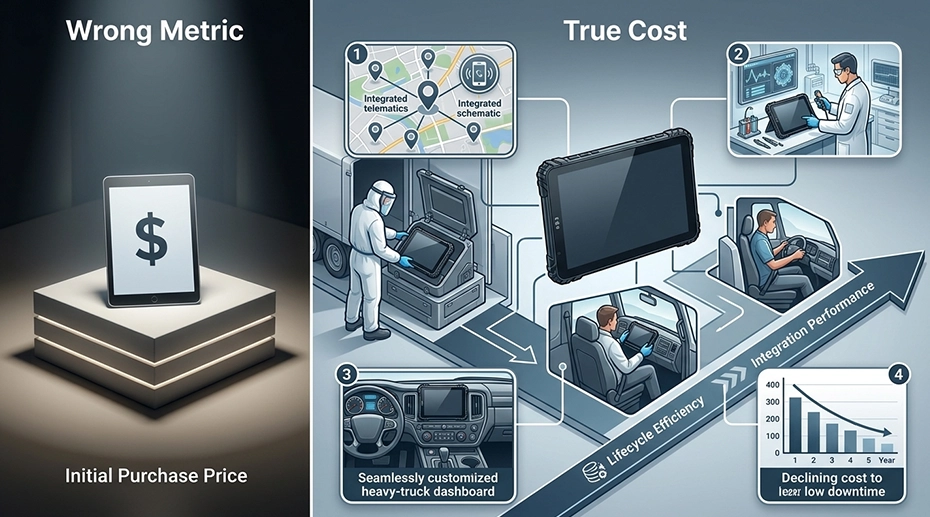
The True Cost of Fleet Hardware – Why Purchase Price Is the Wrong Metric for System Integrators
A client tells you the competitor quoted lower per-device pricing.
What happens next determines whether you win on value — or lose on a comparison that ignores 80% of what the client will actually spend across the contract term.
The Real Conversation
Integrators who consistently win on value don't defend their hardware price. They reframe the discussion around three questions the competitor's quote can't answer:
What happens to the per-unit price when a device fails and there's no spare in inventory?
What does a fragmented fleet of mismatched device models cost in support overhead?
About This Article
TOPICON Business Strategy Series
Derived from financial modeling of fleet hardware deployments across logistics, field service, public safety, and industrial operations. Provides system integrators with a reusable framework for moving client conversations from unit price to total operational cost — without relying on brand names or spec sheets.
What a Unit Price Comparison Actually Misses
Two hardware proposals. Two per-device numbers. The lower one wins — if that's the only variable on the table.
The purchase price of a fleet tablet accounts for roughly 20-30% of what that device costs the client over a 5-year deployment. The rest lives in line items that don't appear on any hardware invoice. Vehicle downtime during device failures. Emergency procurement premiums when a spare isn't available. IT labor for reconfiguring a replacement from scratch. The operational friction of managing a fleet that's accumulated three different device models because replacements were bought one at a time from whoever had stock.
These costs are invisible in a procurement spreadsheet. They're real, they're measurable, and they're entirely absent from a unit price comparison.
When a procurement manager says "your device costs more," the response that changes the conversation is not a defense of the price. It's a question: "What does it cost your operation when a device fails during a route? Let's put that number next to the unit price and compare the full picture." The conversation shifts from cost to risk. Risk is where the integrator's value lives. Hardware engineered for 5-year fleet lifecycles removes the replacement costs that budget devices bake into the operating model.
The Line Item No One Invoices: Vehicle Downtime
A tablet goes dark in a delivery truck. The vehicle doesn't disappear. It sits. The driver waits for a replacement or continues without ELD logging — accumulating compliance exposure with every mile.
The cost of that idle vehicle doesn't appear on any hardware invoice. That's precisely why it's the most powerful number in the integrator's proposal.
What One Hour of Vehicle Downtime Costs
The specific number varies by fleet type. The framework for arriving at it does not:
| Delivery fleet | Lost revenue per undelivered stop + driver wages for idle time + customer service cost of missed delivery notifications + SLA penalty exposure |
| Field service | Lost billable technician hours + travel cost for return trip + parts and inventory carrying cost for delayed jobs + customer SLA credit if response time is missed |
| Long-haul trucking | Lost revenue per mile for the idle period + FMCSA violation exposure if ELD logs are incomplete + detention charges if the delay cascades to loading dock appointments |
Ask the client for their estimated hourly downtime cost. Most fleet managers have a working number even without formal calculation. Multiply it by the expected failure rate of the cheaper device over 5 years. The result typically exceeds the price difference between the two hardware proposals — before factoring in the three costs below.
Why a Replacement Device Costs 2-3x the Original
No pre-configured spare in inventory. Device fails on a Tuesday. Procurement buys whatever is available from whoever has stock, at whatever price. Expedited shipping. The mounting bracket that was included in the original deployment is now a separate SKU. IT spends four hours configuring a single unit instead of fifteen minutes swapping a pre-enrolled spare.
A 50-vehicle fleet at 3% annual failure rate sees 7-8 unplanned replacements over 5 years. Each one costs 2-3x the original unit price. The math isn't complicated. It's just invisible in the initial quote.
An OEM deployment structured with a pre-configured spare pool eliminates emergency procurement from the cost structure. Devices are MDM-enrolled, application-loaded, and deployable in under 15 minutes. The spare pool costs a fraction of even one emergency replacement cycle. Spare device inventory planning done at deployment removes this entire cost category from the client's P&L.
Fleet Fragmentation: The Support Overhead Nobody Budgeted
A fleet that starts uniform doesn't stay that way when replacements are bought one at a time through emergency procurement. Over 3-5 years, the fleet accumulates a mix of device models, OS versions, firmware revisions, and accessory types.
Each variation adds to the support burden. Each emergency replacement makes it worse.
MDM Policy Proliferation
Each device model requires its own MDM policy group. Three models means three sets of policies to maintain. An OS update that breaks one model but not the others forces the IT team to triage across three environments.
Accessory Cascade
The replacement device doesn't fit the existing vehicle dock. The original mounting bracket is incompatible. Each unplanned replacement triggers accessory purchases that weren't in the deployment budget.
Driver Friction
Drivers rotating between vehicles encounter different login procedures, different screen layouts, different behavior. Help desk volume increases. Compliance tasks get skipped because the interface changed since last week.
Spare Pool Inflation
A uniform fleet needs spares for one device model. A fragmented fleet needs spares for every model in circulation. A 50-vehicle fleet with three device models may need 5-6 spares instead of 3.
When "Still Works" Becomes "Can't Update"
The device didn't break. It's still powered on. Still running the app. Still passing MDM compliance checks.
Then the MDM platform raises its minimum supported Android version. Or a security patch requires a kernel version this hardware can't accept. The entire installed base below the cutoff becomes a compliance liability — not because anything failed, but because the OS support window closed.
OS obsolescence forces a fleet-wide replacement that no one budgeted for. The cost is entirely predictable — the manufacturer's OS support commitment tells you exactly when it will happen. A device with a 2-year OS support window guarantees a replacement cycle twice as fast as one with 5-year support. The purchase price difference becomes irrelevant once an unplanned fleet-wide replacement enters the model.

Over a 5-year contract, a device with 2-year OS support must be replaced at least twice — once when support ends around Year 2-3, and again at the planned Year 5 refresh. A device with 5-year OS support is replaced once, at the planned refresh. Planning OS upgrade cycles at deployment prevents obsolescence from becoming a mid-contract crisis.
Four Questions That Reframe a Price Conversation
The objective is not to argue that the hardware is worth more. It's to make the full cost visible — and to be the partner who helped the client see what their own procurement comparison missed.
| 1. | "What does one hour of vehicle downtime cost your operation?" This is the anchor. Every cost multiplier references this number. Most fleet managers know it. If they don't, help them estimate: lost revenue, driver wages, SLA penalties, customer impact. |
| 2. | "How many unplanned device replacements occurred in your fleet last year?" Establishes the baseline failure rate. Multiply by the downtime cost from Question 1. The result is almost always larger than the hardware budget itself. |
| 3. | "When a device fails, how long until a replacement is fully operational?" Reveals whether they have a spare pool, an emergency procurement process, or neither. The answer tells you exactly which hidden costs they're currently absorbing. |
| 4. | "How many different device models are currently in your fleet?" Reveals fragmentation. More than two models means the support overhead is already costing them — and every emergency replacement that adds another model makes it worse. |
Frequently Asked Questions
How do I calculate vehicle downtime cost if the client doesn't have the number?
Start with the simplest formula the client accepts: lost revenue per vehicle per hour plus driver wages for idle time. Delivery fleet: average revenue per stop multiplied by stops per hour. Service fleet: average billable rate multiplied by utilization rate. A rough estimate is better than zero — it surfaces the hidden cost and gives the client something to refine.
Won't the client just use my TCO framework to negotiate a lower price from a competitor?
Possibly. But that competitor must now deliver against the TCO metrics you defined. If their hardware can't match the reliability, OS support commitment, or accessory compatibility you specified, the client holds them accountable. The integrator who defines the evaluation framework has a structural advantage regardless of who wins the deal. OEM platforms with controlled supply chains can deliver on those metrics where resellers of tier-1 hardware often cannot.
Does this framework only work for large fleets?
It works for any fleet size. The numbers are proportionally larger for smaller fleets. A 10-vehicle fleet losing one vehicle loses 10% of capacity. A 100-vehicle fleet losing one loses 1%. Small fleets benefit more from the TCO framework than large ones — each failure has higher relative impact.
How does TOPICON support system integrators in building TCO-based client proposals?
TOPICON provides 5-year hardware lifecycle data, failure rate statistics, OS support commitments, and spare pool planning tools — all designed to help system integrators build credible TCO models for fleet clients. Request our TCO data package for system integrators →
Ready to Build TCO-Based Proposals That Win on Value?
TOPICON provides system integrators with hardware lifecycle data, failure rate benchmarks, and 5-year OS support commitments — the numbers you need to build credible TCO models for fleet clients.
Related Business & Strategy Resources